Agriculture contributes for about 10% of the global greenhouse emissions caused by human activities. The production and use of mineral fertilizers contribute to about 2-3% of the total emissions, about one-tenth of the total emissions from agricultural activities. Farmers and the agricultural industry are therefore requested to reduce their carbon footprint significantly and fast.
In order to know our own footprint as van Iperen International, we have studied the end of last year's footprint for the year 2021. It includes all our activities and products we sell, and the calculations are based on formal databases (like EcoInvent), factory calculations, and estimations. it will give us a benchmark of where we stand today and a starting point to reduce and report on our footprint in the coming years.
Our supply chain flow diagram
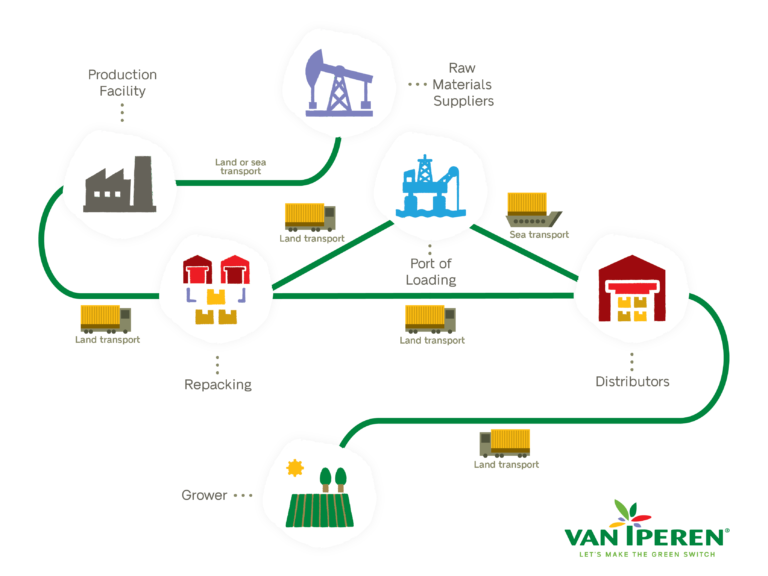
To give you a better understanding of the setup of our activities, we have mapped out our supply chain flow. For each step and for each product, we have calculated the impact on our carbon footprint. It includes not only our own production and supply chain but also the upstream production and raw materials used by our suppliers as well as delivery to our customers/distributors by truck or container. Delivery from the distributor to the grower is not included. After the analysis, we've classified these sources according to our power of influence:
Our CO2 emission per main source
We have identified four categories of carbon emissions resulting from our business activities, which are listed below. We calculated the total emissions for each of these categories to determine their contribution to the total emissions. We also calculated the total emission per kg fertilizer sold in the reference year 2021. As we are a growing company, we find that more relevant than our absolute CO2 emission will be heavily affected by the total quantity we supply to the market.
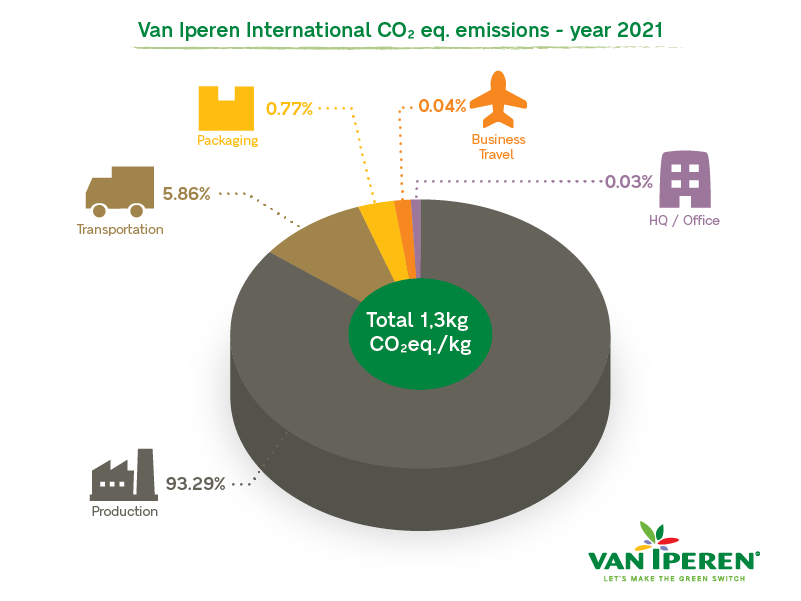
- Production: Mineral fertilizers, particularly but not only nitrogen fertilizers, are known to have a high carbon footprint, and Van Iperen is no exception. The production processes are merely invented at the beginning of the last century and require a high energy input. This category includes the estimated carbon emissions from the actual production of all fertilizers sold, whether produced by us or third parties, in the reference year. It represents, by far, the largest part of our carbon footprint, accounting for 93.29% of our total emissions. It is no real surprise and clearly shows the challenge that our industry and VII must focus on in the coming years.
- Transportation: This is the second-largest source of our emissions, accounting for 5.86% of the total amount. It includes the transportation of raw materials to our production facilities and products shipped to our customers, including upstream and downstream transportation by sea and per truck.
- Packaging: The third source is packaging, which rather surprisingly only accounted for 0.07% of our CO2 emissions. It includes all packaging for our various products, such as bottles, cans, boxes, bags, and labels, as well as pallets. Worthwhile to notice, that packaging waste (mostly plastics) is not only impacting our carbon footprint but also putting pressure on the environment as such. So enough reason to reduce plastic waste as well.
- Office and Travel: Our calculation includes emissions from employee travel, including travel to the office and trips taken around the world to work with our partners. This category also encompasses carbon emissions related to our offices. The impact of our office- and travel activities on the total CO2 equivalent per kilogram of fertilizer sold, represents only 07% of our CO2 emissions. However, it's worth noting that in 2021, our emissions from business travel were lower than in other years due to the COVID-19 pandemic, as our employees were mainly working from home.
All in all, the emissions added up to 1,3 kg CO2 emission per kg of fertilizer sold in 2021. This number is our benchmark that we wish to bring down in the years to come!
What concrete actions is Van Iperen taking?
We have identified a number of key areas and actions that will enable us to dramatically reduce over time the carbon emissions generated by our activities. We list the main ones below but there are many other actions with – as it looks now - a smaller impact.
We are actively engaged in developing new technologies to produce greener, sustainable fertilizers and bring them to the market for high-tech farming. Our GreenSwitch® Nitrate and GreenSwitch® Potassium are two innovative production processes that use organic sources or by-products with a close to zero carbon footprint. These processes have resulted in the creation of two new fertilizers: GreenSwitch® Original HG, which is the first liquid Nitrate fertilizer from an organic source, and GreenSwitch® SOP, the first Potassium Sulphate fertilizer using by-products of recycling industries. The introduction of these sustainable product lines will help us to dramatically reduce the average carbon footprint per kg fertilizer sold, and we aim to introduce more sustainable new fertilizer technologies under the GreenSwitch flag in the near future, in order to allow sustainable crop nutrition without any compromise on yield and quality.
In addition to introducing new technologies, we are also monitoring and making step-by-step plans to reduce the carbon footprint of our more traditional line of products that the market still needs. We do this in full cooperation with our suppliers and motivate them to do steps on their own. We acknowledge that the fertilizer industry still has a long way to go and that the world can not just stop the production of mineral fertilizers with a large carbon footprint, in order to feed the growing world population.
Finally, we have also made a commitment not to introduce any new fertilizer that does not have a positive impact on our carbon footprint compared to what we sold before and to market standards, either immediately or in the near future.
We have devised a plan to lessen our carbon emissions from packaging by increasing the use of recycled plastic for our bags and cans. The aim is to switch as soon as possible, after conscience testing and respecting regulations for packing hazardous materials that some of our fertilizers are.
As fertilizers are voluminous products, transportation is necessary, which has a significant impact on our carbon footprint. We recognize that improving our carbon footprint in this area is not solely within our control and requires cooperation from for instance container liners and trucking companies. Therefore, we will closely monitor their progress in implementing greener solutions, such as switching to green ammonia as a fuel source for container ships , and select and support the best options available once they are established. We will also support and use trucking companies that invest in eco-friendly solutions like green hydrogen-powered trucks. As all this depends on third parties, we did not include yet any potential reduction in our own targets.
Reduction of carbon emissions shall be accomplished by several, mostly small steps and actions, like more online and digital activities, working from home, video conferencing, electrical company cars, etc. that are more and more introduced and accepted also in our industry.
However, we also realize that traveling to meet and support our clients abroad, to introduce new concepts in seminars and with field trials, is a crucial part of our business model and we shall not lower that activity.
We have therefore also decided to compensate this part of our carbon emission with a carbon offset program, the actual choice of the program is yet to be decided in 2023.
Our targets until 2030
The issue of climate change cannot be resolved overnight, and the fertilizer industry including Van Iperen International still has a significant distance to go. We are however committed to succeed and aim to be one of the leaders in our industry by introducing new technologies to produce greener fertilizers (the GreenSwitch line) as well as concepts to help the farmer improve his efficiency (with P4P and other High Performing Solutions) and therefore carbon footprint too. Our slogan 'Let's make the green switch!' embodies this mission.
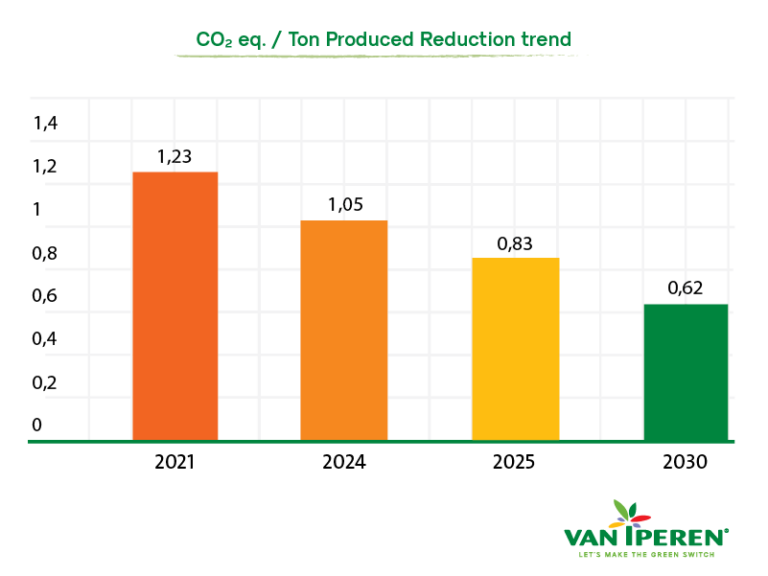
Based on the benchmark of our 2021 emissions, our updated business plan as well as our action plan, the ambition is to reduce our carbon footprint per kg of product sold by more than 50% by 2030, as shown in the table below. This means from 1,3 kg CO2 emission per kg of fertilizer sold in 2021 to 0.6 CO2 emission per kg of fertilizer sold in 2030.
We will continue to provide annual reports on our CO2 emissions to demonstrate real progress. If there is a possibility to speed up the reduction and improve the target, we shall be happy to do so.
Update first quarter 2024
Throughout 2022 and 2023, we dedicated considerable effort to addressing various factors affecting our CO2 footprint. Detailed actions undertaken and their corresponding impacts on our CO2 footprint are outlined in the table below, alongside projections for the calendar year 2024.
By implementing GreenSwitch® technology, the CO2 footprint per kilogram of product produced is substantially reduced in GreenSwitch® SOP production. However, these calculations do not yet include the CO2 reduction resulting from the expansion of the GreenSwitch® Nitrate factory, which will produce GreenSwitch® Original Introduction and GreenSwitch® Nitric Acid with a lower carbon footprint than current methods.
| AREAS | FACTS | FIGURES |
| Production | By implementing GreenSwitch® technology, the CO2 footprint per kilogram of product produced is substantially reduced in GreenSwitch® SOP production. However, these calculations do not yet include the CO2 reduction resulting from the expansion of the GreenSwitch® Nitrate factory, which will produce GreenSwitch® Original Introduction and GreenSwitch® Nitric Acid with a lower carbon footprint than current methods. | 1.05 Kg CO2 eq/Kg product sold |
| Transportation | Container liner companies are embracing the concept of employing carbon-neutral propulsion for their ships, while trucking companies are spearheading the adoption of hydrogen-powered trucks. We are actively observing these developments as we assess our strategic choices. Anticipating no notable enhancements for 2024, we will retain the figures at their 2021 levels. |
0,077 Kg CO2 eq/Kg product sold |
| Packaging | By integrating recycled materials into our diverse packaging formats including cans, bottles, and bags, we foresee a notable decrease in our packaging CO2 footprint. The adoption of recycled cans and bottles is projected to yield a 21% reduction in CO2 emissions. The anticipated CO2 savings from incorporating recycled materials into our bags are still pending determination. Despite these considerable savings, it's essential to acknowledge that their overall impact remains relatively modest in comparison to the emissions generated during the production process. | 0,01 Kg CO2 eq/Kg product sold |
| Office and Travel | Minimizing travel for our sales and agronomist team to provide on-site customer support poses a significant challenge. Since the COVID-19 pandemic, we've successfully established a harmonious blend of in-person and online meetings. Our headquarters staff now adheres to a structured office and home office policy, with three days spent in the office and two days working remotely, thereby reducing commuting time. Furthermore, we are integrating electric cars into our fleet for employees who utilize company vehicles, in line with our sustainability objectives. | 0.001 Kg CO2 eq/Kg product sold |